
Accounting And Financial Management: Case Of British Petroleum
Executive Summary
Accounting and financial management are the main backgrounds of the report under which the financial evaluation of British Petroleum (BP) is conducted. BP is a leading company that explores produces, refines and markets oil and gas products including fuel, lubricants, energy and petrochemicals product. It deals in different segments including upstream, midstream and downstream to the oil and energy production. It serves customers’ demands across the world through globalise operations. Financial performance of the company over the last 5 years is depicting fluctuating trend as its net revenues has continuously been increasing and on the other hand, profits have declined. Financial performance of BP is evaluated with using different categories of ratios, including long term capital, liquidity, investors, financial risk/working capital management, and profitability and cash flow ratios. On the basis of ratio analysis, it is evaluated that BP’s financial position is not satisfactory although it has enough liquid funds as compared to other rivalry firms. Internal and external sources of finance are commonly used to obtain funds by the large company. New equity capital is commonly raised from retained earnings, loans and debentures. Overall, the given report provides a comprehensive knowledge of BP’s financial position in all material aspects.
Getting Tired of Never-Ending Assignments?
Hire an Expert from TheBestAssignmenthelp and Get the Necessary Assignment Help at a Reasonable Rate.
Table of Content
Executive Summary
Introduction
Analysis and History of the Development of British Petroleum Company
Financial Analysis
Liquidity Analysis
- Current Ratio
- Quick Ratio
Working Capital Management Analysis
- Stock Days and Stock Turnover
- Debtor’s Collection Period
- Creditor’s Collection Period
Long Term Gearing
- Capital Gearing
- Interest Coverage Ratio
Cash Flow Ratios
- Operating cash flow to maturing obligations ratio
- Free cash flow ratio
Profitability ratios
- Gross Profit Margin
- Return on Capital Employed
Investment Ratios
- Earnings per share (EPS)
Source of Finance
- Key Areas to be considered
- Aim and Purpose of Obtaining Finance
- Factors Considering for the Source of Finance
BP and Sources of Finance
Conclusion
Reference
Appendix
- Ratio Calculation
- Balance Sheet
- Income Statement
- Cash Flow Statement
Introduction
Analysis and History of the Development of British Petroleum Company
BP is a renowned company in the major integrated oil & gas industry, which serves fuel, lubricants, energy and petrochemicals product. In all the related areas, the company deals to maintain its eminent image including exploration, production, refining, marketing and distribution of oil and gas along with power and petrochemicals production and marketing (BP 2013). There are three main segments within which the company operates including upstream, midstream and downstream. In the upstream segment, BP is involved in the production, field development and exploration of oil and natural gas.Main operations performed under the upstream activities are offshore platforms, processing facilities and wells and pipelines. In around 30 countries, namely India, Russia, Tobago, Norway, Angola, Brazil, Azerbaija, etc., BP Company operates upstream activities. On the other hand, the midstream segment is engaged in the natural gas (natural gas liquids and liquefied natural gas) storage, processing, marketing and trade. Downstream segment of the company is engaged in the petroleum and petrochemicals products related process including refining, manufacturing, transportation, marketing and trade. The operational activities in the downstream segment are furnished at Asia, North America and Europe. In the world, 15 refineries are owned by BP as per the recent figures of 2013. BP initiated its operations in 1889 and is located in London, UK. Currently, BP works with 85700 employees to serve the demand of petroleum, natural gas, motor and aviation fuels throughout the world (BP 2013). Position of BP in this industry is quite good as it efficiently focuses towards social and environmental issues, stakeholder engagement and transparency in operations. In this context, the company is positioned on 1st rank as per ‘Tomorrow Value Rating’ (Oil and Gas 2011). Overall, BP Company gives more emphasis on the corporate social responsibility for the welfare of the society and economy as a whole.
As per the 5 year trend, net revenues/sales of the company decreased during 2008 to 2009 i.e. 196.99 bn to 153.32 bn respectively due to the financial crisis. Later, in the following years, revenues have shown an increasing trend, it was 192.44 bn in 2010, 234.44 bn in 2011 and 237.02 bn in 2012. Despite increased sales, the net income of the company declined during the same period. It was 11.5 bn in 2008 that reduced to 10.6 bn 2009, -2.41 bn in 2010, 16.03 bn in 2011 and 7.31 bn in 2012 (BP Plc ADS 2013). This exhibits that year on year, BP’s net income decreased and its profitability got affected. On an average, the growth rate divided over the last 5 years equals to -4.84%, but dividend per share increased to 17.86% (BP Plc 2013). The positive trend of dividend payment is a good symbol for investment in the oil and gas industry. Overall, the financial position of BP is showing positive results which are evident from the year on year growth
Financial Ratio Analysis
Detailed analysis of each ratio is explained under and their calculation part has been included in appendix.
Liquidity Analysis
Liquidity ratio shows the company’s ability to pay its short term obligation/liabilities. The common ratios used to determine the liquidity position are Current ratio and Quick Ratio. Generally, higher the liquidity ratios are, higher the margin of safety and it shows the company’s position to meet its current liabilities.
(a) Current Ratio
Ratio of Bp and other industry competitors
| Ratio | 2012 | 2011 | Competitors (Chevron Corp) |
| Current ratio | 1.45 | 1.16 | 1.63 |
| Quick Ratio | 1.07 | 0.84 | 1.25 |
(Chevron Corp – CVX 2013)(Refer appendix (i)
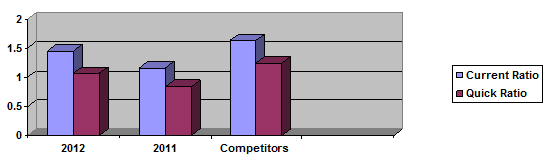
The current ratio is the ratio between current assets and current liabilities. Current Ratio indicates the company’s ability to convert the current assets into cash and cash equivalents quickly so that the current liabilities can be paid off at time (Brigham and Ehrhardt 2011). On analysing the current ratio of BP, it can be concluded that in the year 2011, the results were not satisfactory but in the year 2012, the company showed some progress in maintaining good amount of current assets to pay its liabilities. The ratio of the company in 2011 was 1.16 and in 2012, it was 1.45. Therefore, the company’s liquidity position as compared to the ideal benchmark is not acceptable.
On comparison with the other industry competitors, the ratio of BP shows unsatisfactory figures. This indicates that the company is working less efficiently in comparison with other industry leaders. The increase in the current ratio of the company was due to an increase in working capital in 2012.
(b) Quick Ratio
Quick Ratio, also known as Acid Test ratio, is another type of ratio that is used to measure the liquidity position of the company. This ratio is similar to the current ratio but the only difference is that current assets do not include inventory and prepaid expenses. The reason for not including inventory is that many businesses are not able to convert the inventory easily. So, it is difficult to compare companies that maintain low level of inventory, like service sectors (Brigham and Ehrhardt 2011).
The acid test ratio of BP Corporation stood at 0.84 in the year 2011 and it increased by 27 % to be at 1.07 in the year 2012. The large gap between the current asset and quick asset ratios indicates that the company uses its inventory to derive its liquidity. Therefore, the company achieved the ideal benchmark of 1:1 in 2012.
On comparing with competitors’ ratios, results of BP Corporation are slightly low, which shows that competitors maintain more inventory level than BP Corporation. One of the negative impacts on a company with lower acid test than that of the industry and/or competitors is that lenders and creditors are likely to prefer dealing with other players in the industry as compared to that company. Thus, it is difficult to convince lenders and creditors for short term purposes.
In summary, the liquidity position of the BP Corporation reflects inadequate results than its competitors. It is advisable to BP Corporations that it should increase its investments in the short term assets that will help the company to increase the proportion of liquidity driven by more liquid assets. Hence, it will increase both current and quick ratio.
Working Capital Management Analysis
For any business, working capital management is one of the significant factors to maintain the proper flow of entire production process. It refers to the effective management of the company’s working capital or assets required to run the business on daily basis (Sagner 2010).
Ratios of Bp and other industry competitors
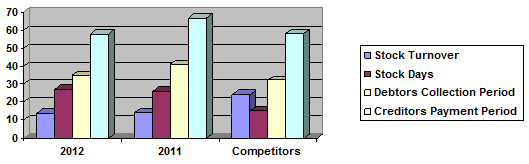
| Ratio | 2012 | 2011 | Competitors (Chevron Corp) |
| Stock Turnover Ratio | 13.51 | 14.04 | 24.09 |
| Stock Days | 27 days | 26 days | 15.15 days |
| Debtors collection period | 35 days | 41 days | 32.27 days |
| Creditors payment period | 58 days | 67 days | 58.24 days |
(Chevron Corp – CVX 2013)(Refer appendix (ii))
(a) Stock Turnover Ratio and Stock Days
Stock turnover ratio reflects the speed of movement of inventory outside the company so as to generate sales, whereas stock days show the number of days for the inventory to be sold out and restocked (Sagner 2010). The stock turnover ratio of BP Corporation was 14.04 % in FY 2011 which decreased by 3 % to be at 13.51 % in FY 2012. This indicates that there is no significant change in the inventory level in the present year. On looking at the stock days, which is 26 days in FY 2011 and 27 days in FY 2012, indicate that the company can sell its inventory in about a month, but it is not upto the desired level.
On comparing both ratios with competitors in the market, the results are totally unsatisfactory. The stock turnover ratio of competitors was 24.09 % which indicates that BP Corporation is not able to convert its stock in cash as fast as its competitors. Comparing the stock days with competitors, i.e. 15.15 days, show that BP Corporation is not working effectively.
(b) Debtor (Receivables) collection period
Debtor collection period states the capability of the company in turning out its receivables into cash so as to meet its current liabilities. This also leads to improve the liquidity position of the company (Bull 2007). Debtor collection period of BP Corporation in FY 2011 was 41 days, which was reduced by 6 days in FY 2012 i.e. 35 days. This significant decrease in the collection period was due to the new policy adopted by the company to collect its receivables more quickly.
(c) Creditors Payment Period
Creditor’s payment period ratio is used to calculate the number of days taken by the company to pay its creditors for the amount of purchases made (Bull 2007). BP Corporation payment period was 67 days in FY 2011, which decreased to 58 days in FY 2012. The decrease in payment period was mainly due to the decrease in receivables collection period.
Compared to competitors (58.24 days), BP Corporation was not effective in 2011, but in 2012, there was a significant decrease in the payment time that made the company to stand with other competitors.
Long term capital Ratios
Long term capital or gearing ratio indicates the percentage of debt in the company’s capital structure. So higher the gearing ratios, higher is the financial risk. The company has to pay the interest amount on the borrowed amount regardless of any revenue. Therefore, at the time of financial crises, the company is not able to pay its financial charges and has to use its retained earnings, or otherwise the company gets into the position of bankruptcy (Bull 2007).
Ratios of Bp and other industry competitors
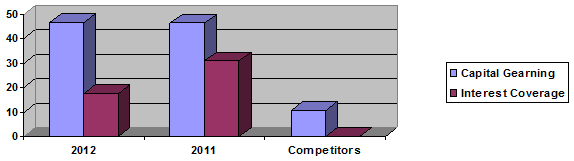
| Ratio | 2012 | 2011 | Competitors (Chevron Corp) |
| Capital gearing ratio | 46.51 % | 46.34 % | 10.80 % |
| Interest Cover ratio | 17.54 times | 31.95 times |
(Chevron Corp – CVX 2013)(Refer appendix (iii))
- a) Capital Gearing Ratio
Capital gearing ratio calculates the amount of geared part (Long term debt) in the total capital employed. It is the measure of degree of financial leverage, indicating the degree to which a company’s activities are funded by owner’s funds against outsider’s funds. BP Corporation’s capital gearing ratio was 46.34 % in FY 2011 and 46.51 % in FY 2012. On comparing with the same industry competitors, which have the gearing ratio of 10.80 %, it can be concluded that the company has taken more loan amount. This indicates that the BP Corporation is at more financial risk as compared to other key players (Bull 2007).
(b) Interest Coverage ratio
Interest coverage ratio helps to calculate the company’s ability to pay its interest expenses. Higher the coverage ratio, lower the financial risk (Bull 2007). The interest coverage ratio of BP Corporation was 31.95 times in FY 2011, which was decreased by 45 % in FY 2012 with 17.54 times. The decrease in the coverage ratio attributes to increase the long term liabilities and decrease the EBIT.
In the nutshell, it can be concluded that the leverage position of the company is not as good as it should be. The company has a sufficient amount of profit to cover the interest expenses. This makes the company financially viable to make loans in the market.
Cash Flow Ratios
Cash flow is the most important element in evaluating the company’s financial performance as it is not affected by any accounting policy. Therefore, it cannot be directly managed or manipulated.
Ratios of Bp and other industry competitors
| Ratio | 2012 | 2011 | Competitors |
| OCF to maturing obligations ratio | 380.37 % | 380.59 % | 88 % |
| Free cash flow ratio | 0.88 | 1.24 | 1.25 |
| Cash exhaustion ratio | 711 days | 568 days | 223 days |
(Chevron Corp – CVX 2013)(Refer appendix (iv))
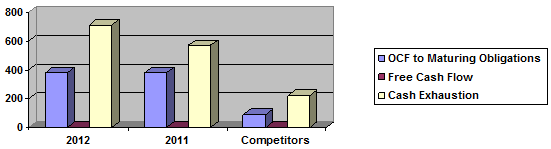
This is used to calculate the extent to which the cash is generated from the operation activities to meet the current obligations (Bull 2007). This ratio was 380.59 % in FY 2011 and in FY 2012, it was decreased to 380.37 %. The current ratio was similar to the previous one as there is no major change in the amount of current liabilities. The competitor ratio was 88 %, which indicates that BP Corporation is much stronger in paying its current obligations at time.
(b) Free Cash flow
FCF shows the company’s ability to cover the capital expenditure by using the cash flow from operating activity (Bull 2007).BP Corporation FCF was 1.24 times in FY 2011, which decreased to 0.88 times in FY 2012. The decrease was mainly due to the increase in the capital expenditure and decrease in the cash flow from the operating activity. The competitor’s ratio of 1.25 times indicates that the company is working efficiently to cover up the capital expenditures.
Profitability ratios
Analysis of profitability ratio helps to calculate the turnovers, margins and different returns on investments made by the company.
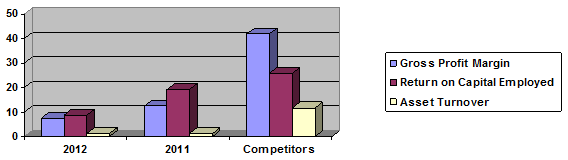
Ratios of Bp and other industry competitors
| Ratio | 2012 | 2011 | Competitors |
| Gross Profit Margin | 7.39 % | 12.34 % | 41.81 % |
| Return on Capital Employed | 8.91 % | 19.16 % | 25.77 % |
| Asset Turnover | 1.25 | 1.28 | 11.83 |
(Chevron Corp – CVX 2013)(Refer appendix (v)

This ratio reflects the margin that is left out with the company after meeting its manufacturing cost (Bull 2007). BP Corporation gross profit ratio was 12.34 % in FY 2011, which decreased to 7.39 % in FY 2012. Competitor’s ratio was 41.81 %, which indicates that BP Corporation revenue income is not that sufficient to cover all the manufacturing expenses.
(b) Return on Capital Employed
The return on capital employed can be obtained by dividing the net profit by the capital employed (Bull 2007). BP Corporation Return on capital employed ratio was 19.16 % in FY 2011, which was decreased to 8.91 % in FY 2012. Competitor’s ratio was 25.77 %, which shows that the earning capability of the company is not effective or upto the mark.
Investment Ratios
Ratios of Bp and other industry competitors
| Ratio | 2012 | 2011 | Competitors |
| Dividend yield | 0.77 % | 0.68 % | |
| Dividend Cover | 2.23 Times | 6.41 Times | 3.80 times |
| Earnings per share | 0.608 $ | 1.359 $ | 13.42 $ |
(Chevron Corp – CVX 2013)(Refer appendix (vi))
Earnings per share of a company indicate the ratio of the company’s earnings to the amount of shares held during the fiscal year. For the ordinary shareholders, the amount of earning available is simply the profit generated in a given financial year less taxation, preference dividend, and interest expense. BP Corporation EPS was 1.359 $ in FY 2011, which decreased to 0.608 $ in FY 2012. Competitor’s EPS was 13.42 $, which indicates that the company is not earning enough to compete the industry competitors.
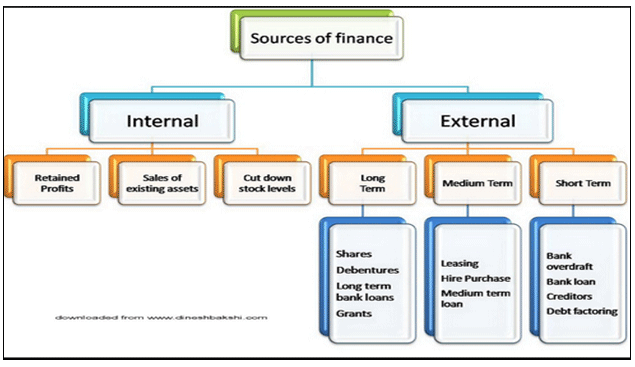
Sources of Finance
Leading organisations can obtain required/additional capital by using the available sources of finance that are categorised under two heads, namely, internal and external financing. Internal financial sources comprise retained profits, sales of existing assets, reduced level of inventories, and long time grant for supplier payment and timely collection for debtors. On the other hand, the sources of finance that are available in the external option are of three types including long, medium and short term. Long term source of finance includes shares, debentures, bank loan and grants, while medium term sources include hire purchase, leasing and bank loan for medium and short term, including bank loan, creditors and bank loan/overdraft (Buckle, Buckle and Thompson 2004).
This shows that a number of financing options are available in the market through which organisations can get funds easily, but the lending organisations need to consider certain financial areas when considering a loan application. The following areas that should be considered are depicted as follow:
Debt position: The lending organisation should consider the debt position of the company to measure whether the current debt exceeds to the defined limit or not. This financial aspect helps the lending firms to determine the worth of the company, which is used as a base for granting loan application. An analysis of debt position indicates the firms’ ability to pay off long term debts and procure additional loans (Houston and Brigham 2009). In the capital structure, the proportion of debt and equity used in the asset financing can be determined with this and further the same information will be used to measure financial burden on the company in order to its ability to serve the loan on the due date and long term solvency.
Liquidity: Liquidity indicates the firm’s ability to pay out the credit on time. Review of liquidity position aids in determining the capacity to meet the loan instalments when they are due as it reveals cash or liquid assets availability (Götze, Northcott and Schuster 2007). This financial area is significant for lending organisations to consider while viewing a loan application to measure whether the firm has enough liquid funds to pay the loan amount on time.
Market reputation and risk: This is another financial area that is directly linked to the financial status as good market reputation and low risk indicate less chances of payment default. Market reputation is important to be considered for the lending institution to evaluate the trustworthiness in respect to the credit history, while risk indicates the level of risk in the company’s matters and operational dealings.
Profitability Growth: Growth of the company in terms of profits must be considered by a lending organisation as this is one of the key financial areas that reflect the earning power and capability. It could be easy for the lending firms to ascertain solvency over the short or long run with the evaluation of the profit earning and amount to be given out as loan. Profitability growth area is important to find out the ability to earn maximum profit by utilising available resources in the best possible way (Ezenwa 2013).
On the basis of the key financial areas, the lending organisation will be looking for the borrower‘s capability of paying back the loan amount with interest within the due period. It considers all factors that affect the decision to grant a loan application such as profitability, long term solvency, debt position, past credit history, risk and growth prospect. On this basis, the main focus of the lending organisation is to provide loan to the borrower, who has enough financial means and possess high ability to service the loan. Overall, the lending organisations look for the commitment and trustworthiness of the loan taker or borrowers in order to fulfil their loan requisite.
Aim and Purpose of Obtaining Finance:
The main aim and purpose of obtaining finance from a large company are the business expansion and development. Today, a business requires additional capital/funds to adopt new technological advancements for better and faster processing. Moreover, companies obtain finance for flourishing the business units worldwide to capture a large market share, and ultimately contribute in keeping the sustainable position in the future. BP Company aims to obtain funds to expand its operations across the Gulf regions (Blackden 2013). In addition to this, the company is aimed to push forward its segment of exploration and production in order to improve the level of production along with expanding its global reach. This would aid in saving BP’s operations by enhancing the production capability. Funds are to be obtained to payoff short and long term obligations that are due within a short time interval. Overall, the large company plans to obtain funds to explore business area/operations, improve production efficiency, and technology advancements in order to sustain growth in all aspects.
Factors considering for the Source of Finance
Although the selection of the appropriate source of finance from the internal and external financing options is done on the basis of the fund requirements in the business, but there exist certain factors that need to be taken into account while deciding the source of finance, these are as under:
Flexibility: Flexibility with the future financing decision is the most significant factor that must be taken into account as there is a direct interlink between present and future financial decisions. Flexibility in terms of paying short and long term debt is also needed to be taken into account as there is no provision of penalty for early payment in case of short term borrowing, while it is penalised in case of long term.
Rate of Interest: This is another factor needed to be taken while preferring financing option for long, medium and short term. The rate of interest is not high in case of short term debts like in long and medium term debt. This factor aids in deciding the source that is suitable for a shorter period and has low probability of investment loss (Mumba 2013).
Tax Benefit: Tax benefit or shield is also one of the factors that affect the selection of financing option/source. Tax shield or benefit is different in case of short and long term sources of finance (Ujwary-Gil 2011).
Financial Risk and Outside Intervention: Financial risk and outside intervention in the company’s affairs is also considered while deciding the source of finance. Internal sources of finance are comparatively less risky than external sources of finance. Moreover, raised funds from creditors induce probability of high outside intervention and high chances of information threat (Ujwary-Gil 2011). New equity financial options including retained profits, bank loans and debentures are the commonly preferred options having low financial risk.
BP and Sources of Finance
On the basis of the above discussed financial areas concerned for loan, it is being evaluated that whether BP would lend 10% of the total net assets as a ten year loan or not. The debt position of BP shows high sufficient margin for creditors due to increased stake of equity holders. As looking to the debt/equity ratio, it is analysed that the proportion of debt into equity has been decreased over the period of 2010 to 2012, which is indicated from the decreased value of the debt/equity ratio. It was 1.866 in 2010 that decreased to 1.62 in 2011 and 1.53 in 2012 (Yahoo Finance) that shows year on year improvement in the debt position of BP.
As concerned to the liquidity position, BP’s efficiency to pay short term obligations has slightly improved from 1.12 in 2010 to 1.43 in 2012. Despite the improvement in liquidity position, BP’s ability to payoff short term debts on its due date is not satisfactory as per the standard ratio of 2:1. On the other hand, BP Company has enough liquid assets as compare to the industry average and thus, granting a bank loan to the company for a period of ten years is not risky for the lending organisation. Market reputation of BP is quite good which is evident from increased net revenues. Over the long term, granting 10% of the total assets (300,193,000*10%) i.e. 30,019,300 (Yahoo finance) for 10 years is profitable over the long run.
Profitability of the company has declined as compare to the previous year as its expenditure has increased (Yahoo Finance). In the long run, BP’s plan of expansion in Gulf would lead in gaining more and more profits and it is expected that the net income of the company will increased due to its improved debt position and good market reputation. Overall, it is concluded that ten year loan of 30,019,300 will be lend to BP as its financial position is showing improvement year on year and thereby, it is expected that the position of the company will also turn up in the long run.
Conclusion
In this report, analysis of last two annual reports for BP Corporation has been done. Most of the financial ratios used to conduct the company analysis have indicated that the company has a moderate financial position. The financial leverage position of the company is not satisfactory because earning before interest and tax is enough to cover all the interest expenses. In spite of huge profits made in the last two years, a return to dividend declared has remained low. A company that relies heavily on the internal sources of finance is less likely to declare high dividends as compared to those that rely on the external sources of finance, for example, loans. Desire to retain high liquidity levels are yet another reason why BP declared little dividends in fiscal 2011.
The other section of report discussed some sources of finance to the company. It has been noticed that cash flows, financial accounting, liquidity, and need for cash are some areas the company need to consider before choosing a certain source of finance. Company is able to generate enough cash flow to pay dividends, undertake new investment projects, and maintain good liquidity ratios that attract lenders. Additionally, lenders will be keen on the financial accounting process of borrowers. Audited financial statements provide good information to a potential lender and company also has enough return to pay all the interest expenses. Therefore, lenders can provide bank loan for 10 years based on its net assets.
Reference:
Blackden, R. 2013. BP Urged to Keep Up Gulf Expansion. The Telegraph.
BP PLC ADS. 2013.
BP PLC. 2013.
Bp. 2012. Annual Report and Form 20-F 2012.
BP. 2013.
Brigham, E. F. and Ehrhardt, M. C. 2011. Financial Management: Theory and Practice. Mason: Cengage Learning.
Buckle, M.J., Buckle, M. and Thompson, J. 2004 . The UK Financial System. 4th ed. New York: Manchester University Press.
Bull, R. 2007. Financial Ratios: How to use financial ratios to maximise value and success for your business’. UK: Elsevier.
Chevron Corp – CVX 2013. Morning Star – Key Ratios.
Ezenwa, E. 2013. Some Factors Bank Managers Consider Before Granting LoansAvailable at:
Götze, U., Northcott, D. and Schuster, P. 2007. Investment Appraisal: Methods and Models. Springer.
Houston, J.F. and Brigham, E.F. 2009. Fundamentals of Financial Management. Cengage Learning.
The Best Assignment help is one of the best website for assignment help. For more details you may contact us at thebestassignmenthelp@gmail.com or call at +447418324884, +918607503827
visit at : Achievement Of Environmental Goals At Visy